Spot abnormal values (Tutorial)#
Note
This is the Spot abnormal values tutorial. The Spot abnormal values documentation is available here.
Prerequisites#
To get the most out of this tutorial, take the previous tutorial, Predict Missing Values first.
Compute the abnormality score#
If you have not done it already, make a copy of the tutorial sheet.
Open the tab called “Case #2: Spot abnormal values”.
This sheet contains physiological data about abalones (a type of marine snail). Like in task #1, each row represents an animal while each column represents a physiological aspect of the animals.
Scientists can tell the age of an abalone from the number of rings in its shell like you can tell the age of a tree by the number of rings in its trunk. This dataset contains records for around 4’000 abalones. In this task, the goal is to look for abnormalities in the number of rings in abalones.
Select the Case #2: Spot abnormal values tab
If Simple ML is not already open, open it Extension > Simple ML > Start
Under What do you want to do? click on Spot abnormal values.
Select the column you want to analyze. In this case, it’s the Rings column.
Click Spot abnormal values.
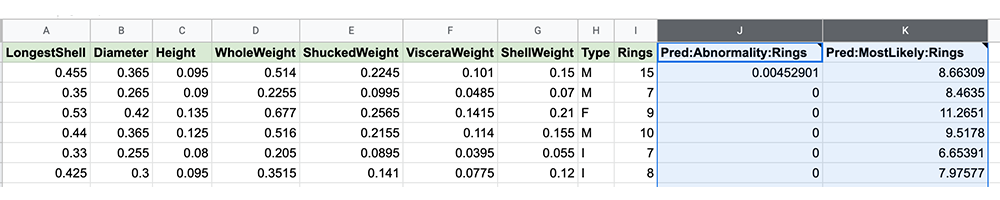
After a few seconds, two new columns are created on the right side of your data: Pred:Abnormality:Rings and Pred:Mostlikely:Rings.
Pred:Abnormality:Rings are the “abnormality scores” ranging from 0 (most normal) to 1 (most abnormal). They tell how similar to other values each row is.
Pred:MostLikely are the most likely predicted values for the selected column. In some cases, this will be the same as the existing value, in other cases, the predicted value will be different than the existing value.
Look for the most abnormal rows#
It is sometimes interesting to look at the most “abnormal” values by sorting the
rows according to the Pred:Abnormality column. Abnormal values are sometimes
indicative of an error in the data or a normal aspect of the dataset.
Note
While counterintuitive, in many situations it is normal to have abnormal values, and it is abnormal for all the rows to behave the same. This means that a value with a high abnormality score does not necessarily mean that the value has errors or was misreported.
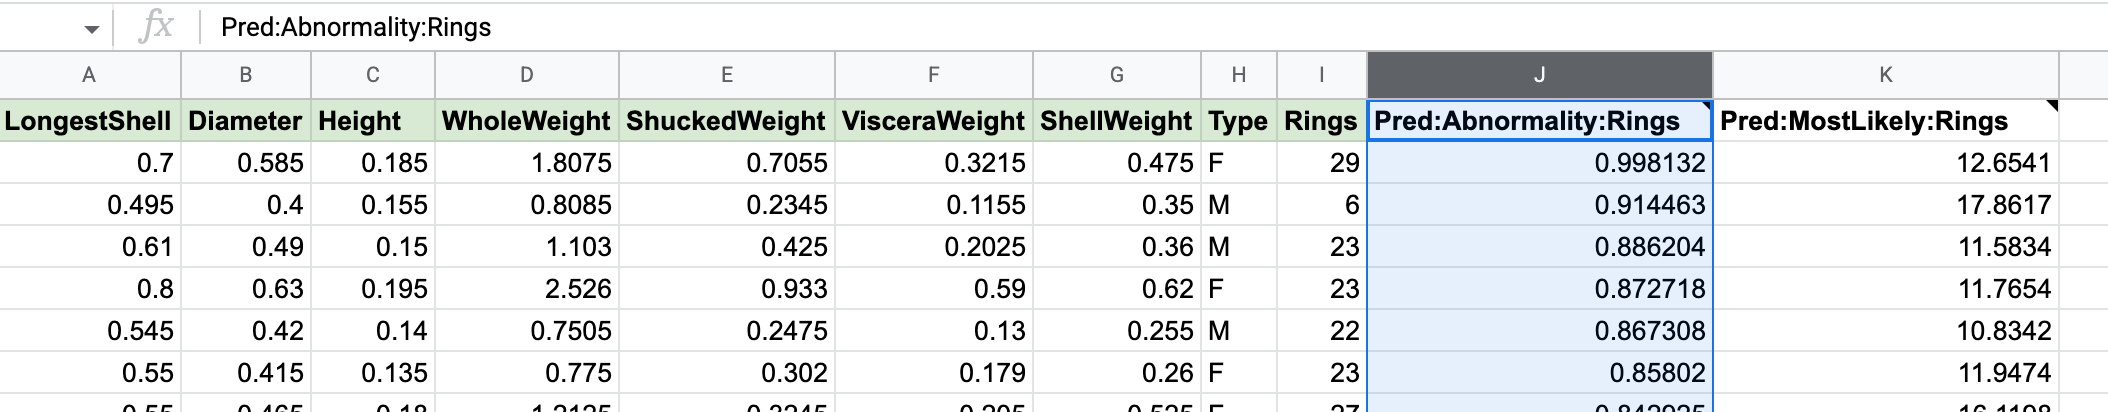
Select the column header for the Pred:Abnormality:Rings column by clicking on the “Pred:Abnormality:Rings” text.
In the Data menu, click Sort Sheet > Sort Sheet By Column J (Z to A). Make sure to choose Z to A otherwise the rows with values greater than 0 in that column will be at the bottom of the sheet.
Once the sheet is sorted with the highest abnormality values at the top, look at the first row/animal: The first abalone has 29 rings, which is a lot. But the model thinks that this abalone should only have 12 or 13 rings. In other words, this abalone is very old, but it looks much younger.
Look at other columns#
Continue to explore abnormal values for other columns (and change some values manually if you like).
For the ML experts
Under the hood, ten different models are trained using a 10-fold cross-validation protocol. Each value in the target column is then compared to the prediction of the corresponding model in the cross-validation. If the existing value and the predicted value do not match, the row is considered abnormal. For details, check the task documentation.
You can also remove some of the features from Source Columns or change the learning algorithm: By default Simple ML uses a Gradient Boosted Trees learning algorithm.