Forecast future values#
Note
This is the Forecast future values tutorial. The Forecast future values documentation is available here.
In the previous tutorials, you learned how to install Simple ML, how to use it to predict missing values and how to use it to spot abnormal data.
This tutorial walks you through how to forecast future values based on past historical data using Simple ML for Sheets. This forecasting technique can be used to forecast sales, price, traffic and many other types of time series data.
Prerequisites#
To get the most out of this tutorial, take on of the previous tutorials, e.g., Predict missing values first.
What is forecasting?#
Forecasting is the prediction of future events based on past data, and is central to decision-making in many technical domains. For instance, predicting product sales in retail, forecasting energy demand, or anticipating customer churn, all have tremendous value across different industries.
Forecasting is different from other Simple ML activities like predicting missing values or spotting abnormal values in your data because forecasting relies on having data accumulated over time. Forecasting uses historical data to predict future data by looking for patterns in the data over time. You can only forecast future values if each example in the dataset includes the time or date from the data that was collected.
Task: Forecast future values for a single column#
If you have not done it already, make a copy of the tutorial sheet, and open the tab called “Case #4: Forecast future values”.
In this tutorial, we will use Simple ML to forecast future values. We will assume that you are a data analyst in an air travel company in the 1960s, and you have records of the number of monthly passengers from January 1949 to December 1960. Your objective is to predict the traffic from January 1961 to May 1963.
Let’s use Simple ML to do this forecast.
Scroll through the spreadsheet. Each row shows a month with the corresponding traffic for that month. At the bottom of the sheet, several dates do not have a corresponding traffic value.
Open the Simple ML addon in the spreadsheet. In the menu bar, click on Extensions > Simple ML for Sheets > Start, and wait for the addon to appear.
Make sure you are in the tab Case #4: Forecast future values.
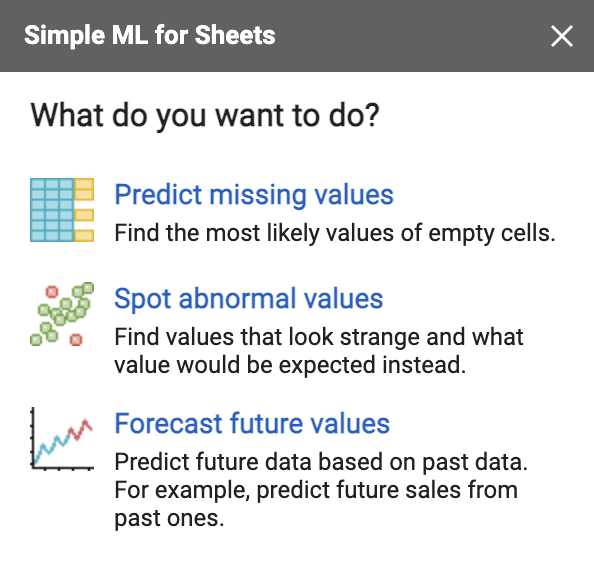
In Simple ML, click on the Forecast future values task.
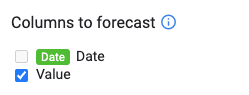
In the Columns to forecast section, make sure the column Value is selected. This is the column that contains the series to forecast.
Click the Forecast button.

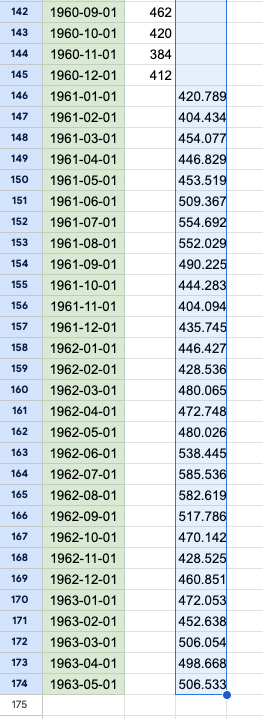
After a few seconds, a new column called
Pred:Valueand a new plot appears. This column contains the forecasted values, and the plot shows both the existing and forecasted values.First, scroll again to the bottom of the sheet to see the newly forecasted values.
Look at the chart.
Looking at data is critical to understanding it. Simple ML automatically created a chart containing the original and forecasted values. On this chart, the horizontal axis represents the time. The vertical axis represents the original values (
Value) and forecasted values (Pred:Value).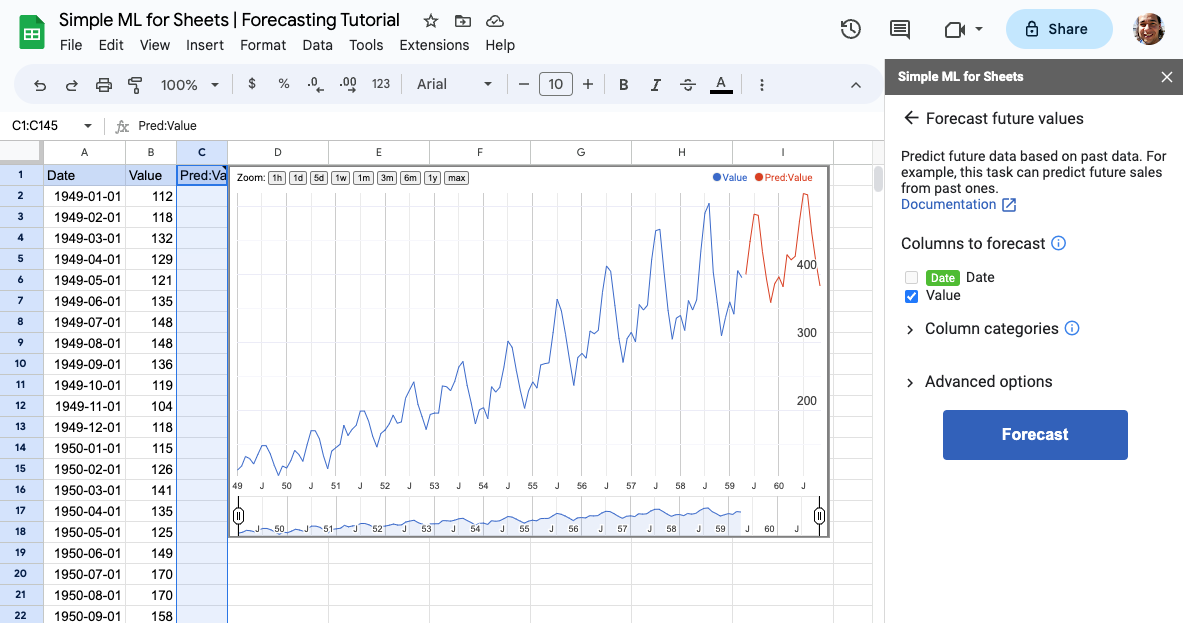
Note that the forecasted values show the same cyclical pattern as the original values. Also see that Simple ML forecasts that traffic will continue to grow.
For the ML experts: The forecasting is done by ensembling two ARIMA and two ETS models.
Forecast future values for multiple columns and associated static data#
In the previous example, we predicted the future value of a single quantity: traffic. However, Simple ML can also predict multiple quantities together. This is called multivariate forecasting, and it can often provide more accurate predictions than predicting quantities individually.
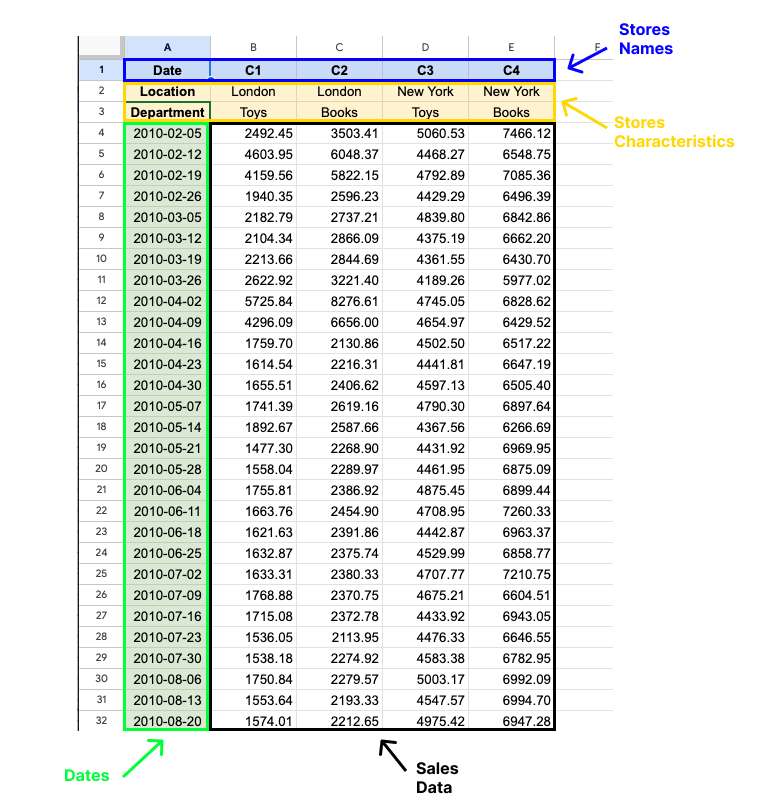
To learn more about multivariate forecasting, open the tab called “Case #5: Forecast multiple future values”. In this scenario, you will forecast the sales of two departments (toys and books) of two stores respectively located in London and New York.
The data consists of weekly sales organized in four columns. For example, the column C1 shows the sales of toys in the London shop.
The location and department characteristics are called column categories. They are static characteristics that help Simple ML to connect columns together in order to improve forecasting results.
As in the previous scenario, the first column shows the date. The other columns show the values to forecast. At the bottom of the sheet, dates without values correspond to the dates to forecast.
Forecasting multiple series:#
In the spreadsheet, select the Case #5: Forecast multiple future values tab.
If Simple ML is not already open, open it: Extension > Simple ML for Sheets > Start.
In Simple ML, select the Forecast future values task.
Ensure the columns to forecast (C1-4) are selected.
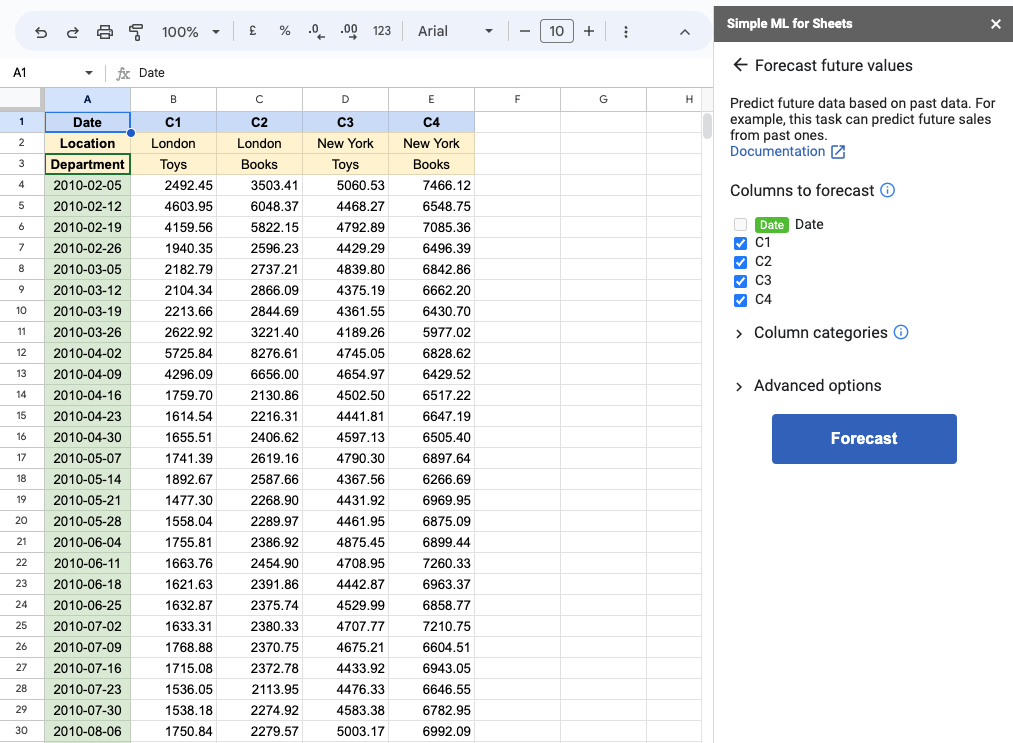
Click Forecast.
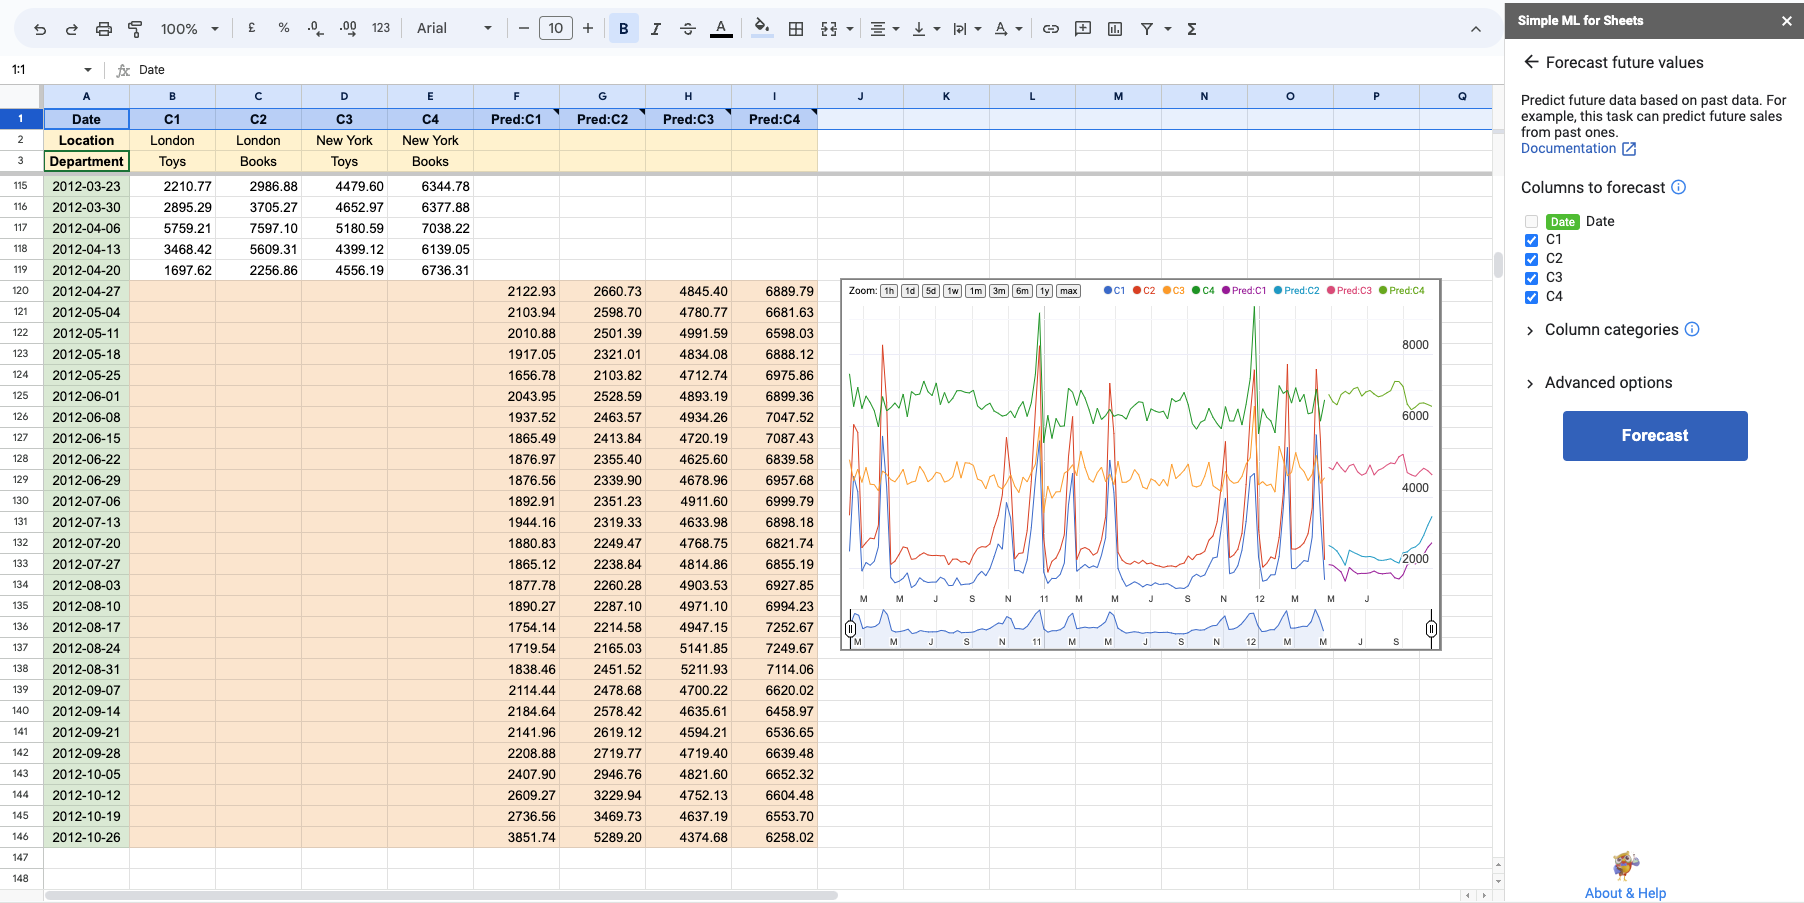
After a few seconds, forecasted values appear in new columns:
Pred:C1-4.[Optional] Freeze the first row: Select the first row, right click on it and select View more row actions -> Freeze up to row 1.).
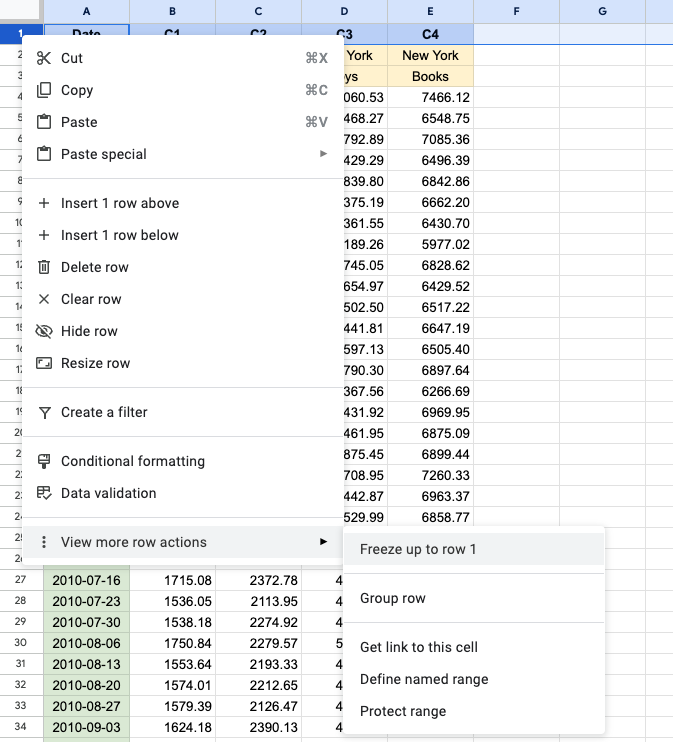
[Optional] Expand the freezing to rows 2 and 3.
Scroll to the bottom of the sheet and look at the forecasted values.
The same way Simple ML plotted the values for the first task, it plots the values for the multiple time series in this task.
Going deeper#
Congratulations to you if you reached this point in the tutorial. You now can use Machine Learning to solve real problems. We invite you to put this new knowledge to practice on your data.
Like riding a bike, it might seem hard at first, but it becomes easy quickly: You will see opportunities for ML everywhere in no time 😀.
This marks the end of the tutorials about how to use Simple ML to predict, analyze and forecast data in your spreadsheet. The next tutorials shows how ML experts can do standard ML work with Simple ML. The next tutorial is written for people who are already familiar with machine learning but we encourage everybody to read it.
If you want to learn Machine Learning, you should check out the Google Machine Learning class and use Simple ML to practice.